In this article
Statistics
When you ask a quantitative question, Online Surveys automatically calculates useful statistics to help you understand the responses at a glance
Finding statistics
To view statistics for your quantitative questions:
- Go to your survey’s Analyse overview page.
- Find the chart for the question you want to view stats for.
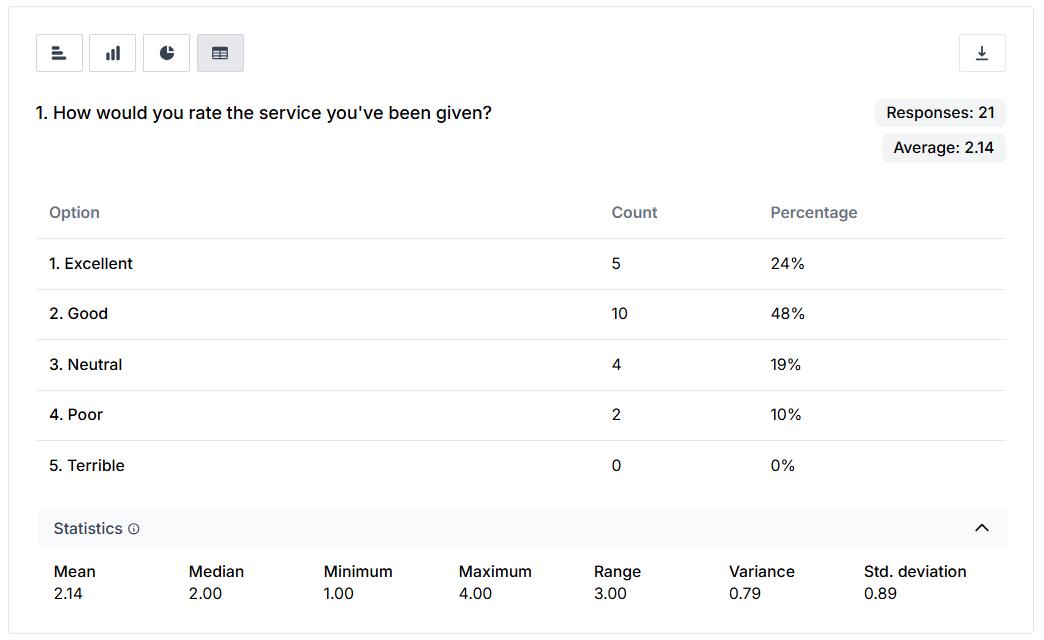
- Click Table view.
- Expand the Statistics accordion.
Understanding the statistics
All statistics are calculated using the numeric values assigned to each response option (e.g. 1 = Excellent, 2 = Good, etc.) and the number of times each option was selected.
This means we’re not just looking at the labels (like “Good” or “Poor”), but at the actual numbers behind them, along with how frequently each number was chosen. These values and counts are used to compute the average, middle value, range, and how spread out the responses are.
| Statistic | Description |
|---|---|
| Mean | The average of all responses. |
| Median | The middle value when all responses are ordered from lowest to highest. |
| Minimum | The lowest value anyone selected. |
| Maximum | The highest value anyone selected. |
| Range | The difference between the maximum and minimum. |
| Variance | Measures how spread out the responses are. |
| Standard deviation | The square root of the variance. It tells you how much responses vary from the mean. |