Product updates
Here’s features and improvements we’ve recently released.
Have feedback or an idea for something new? Share your suggestions with our team here, we’d love to hear from you.
Introducing: Image choice questions
- New feature
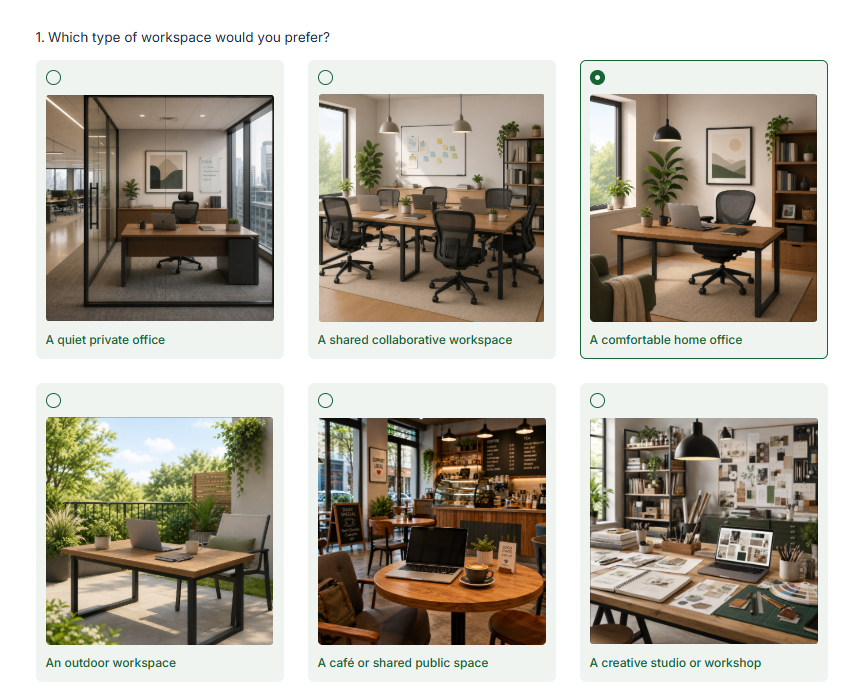
If you need your respondents to choose between images rather than text-only answer options, there’s no longer any need for tricky workarounds. You can now add an independent Image choice question to your survey.
The new Image choice question lets respondents select one or more images as their answer. You can use it to collect visual preferences, compare designs, identify objects, or present choices that are easier to understand visually.
Choose between Single answer and Multiple answer questions, add an option label to each image, and provide alternative text to make your choices accessible to screen reader users
Why it helps:
Collect visual feedback in an engaging and intuitive way.
Compare designs, concepts, products, locations, and other visual options.
Allow respondents to select either one image or multiple images.
- Add labels and alternative text to make image options clear and accessible
A more visual way to collect preferences and feedback — now available in Jisc Online Surveys.
Allow your respondents to tell you when your answers don't apply
- New feature
Need respondents to tell you when none of your answer options apply?
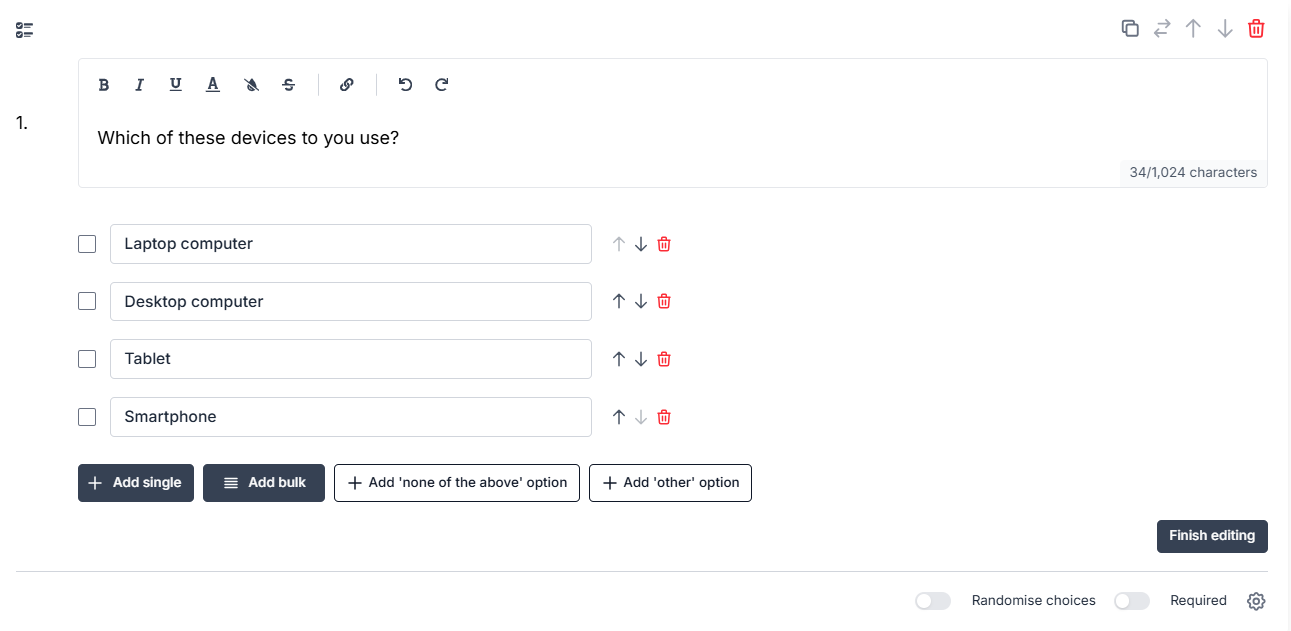
You can now add a None of the above option to multiple-answer Choice questions. This gives respondents a clear way to say that none of the listed options are relevant to them, without needing to skip the question or choose an inaccurate answer.
When selected, None of the above automatically clears any other selected options. If a respondent then selects another answer, None of the above is cleared. This helps keep your response data clean and avoids contradictory answers.
Why it helps you:
Give respondents a clearer way to answer when no options apply.
Reduce misleading or inaccurate responses.
Keep Multiple answer data cleaner by preventing conflicting selections.
A small but useful improvement for creating better answer options — now available for multi-answer Choice questions.
Introducing: Slider questions
- New feature
Need respondents to give a rating, score, percentage, amount, or other numeric answer? You can now add a Slider question to your survey.
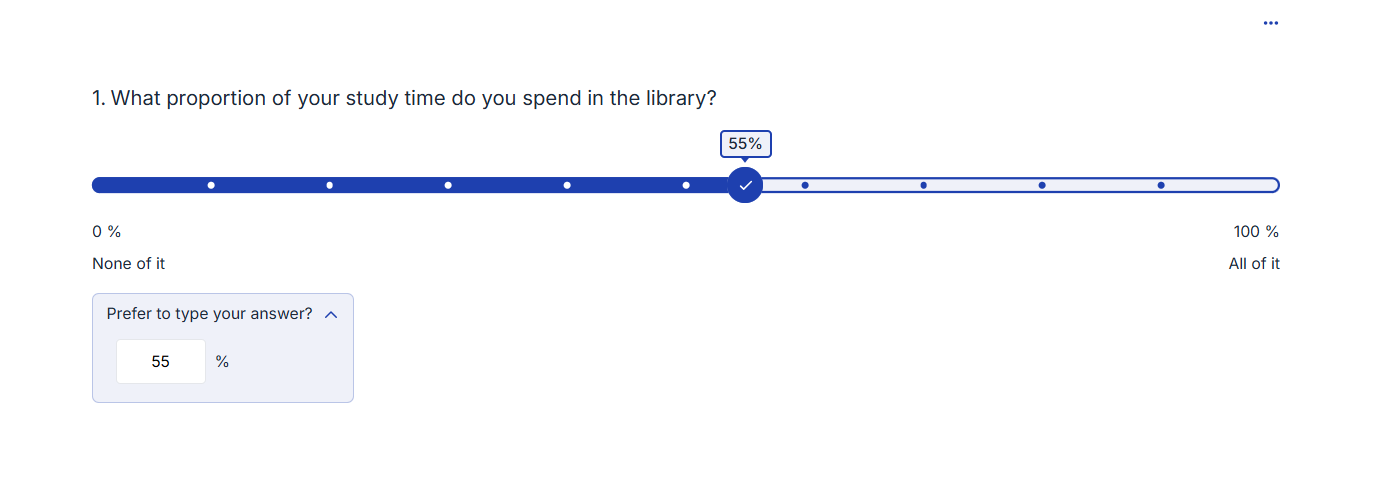
The new Slider question lets respondents choose a value from a scale you define. They can move the slider handle along your scale to select their answer.
The Slider can be customised by setting the minimum and maximum values, decimal places, prefixes or suffixes, scale labels, and the starting position of the slider handle. It comes with the option of allowing a typed value, making it fully accessible.
Why it helps:
Collect numeric responses in a simple, visual way.
Create rating scales, percentage questions, price questions, and more.
Give respondents the option to type their for full accessibility.
A flexible way to capture numbers, ratings, and scores — now available in Jisc Online Surveys.
Drag, drop and add items exactly where you need them
- Enhancement
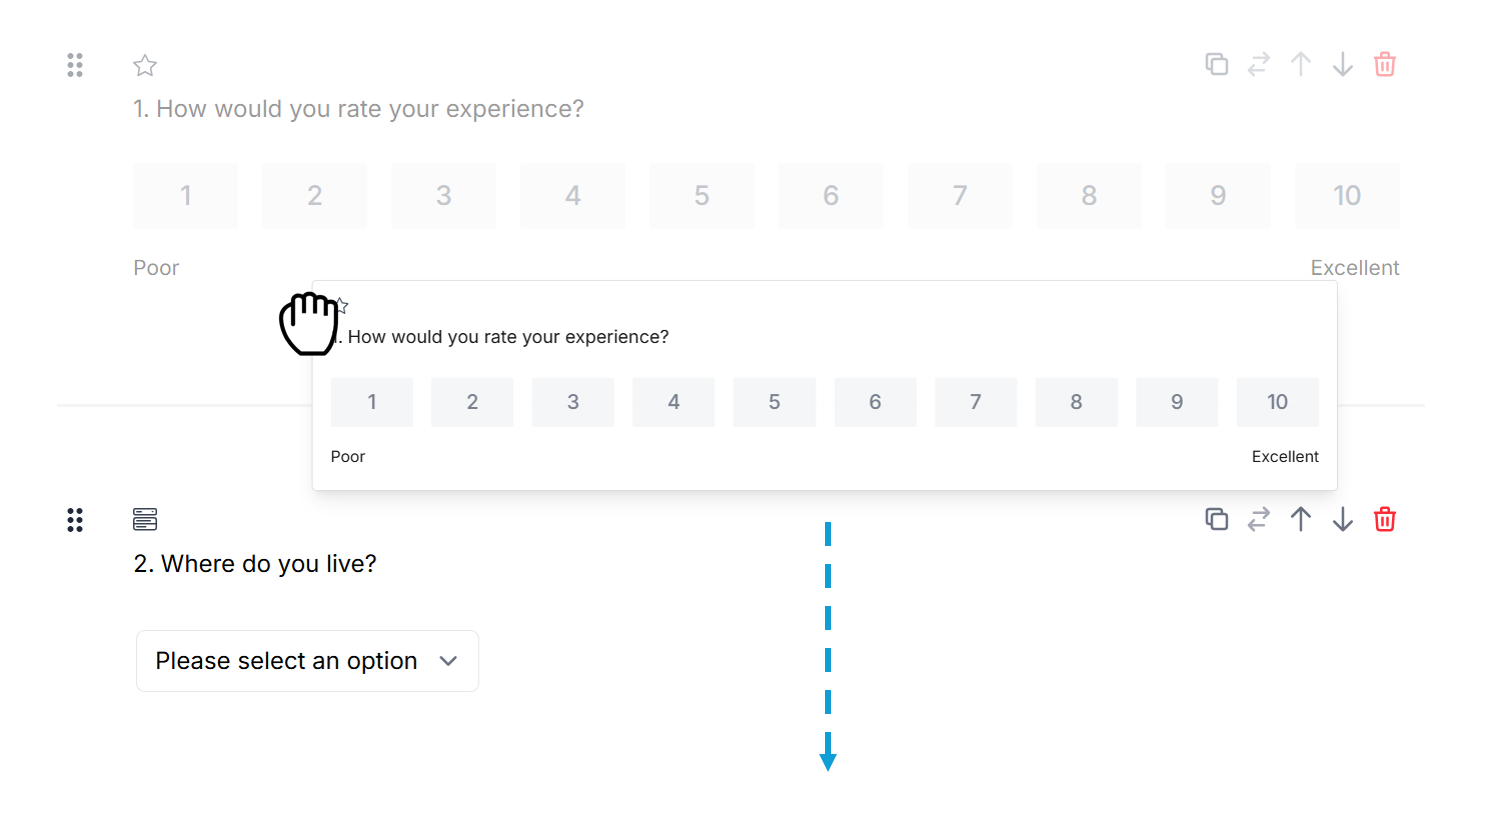
Need to rearrange your survey, add a new question between existing ones, or quickly refine the flow of a page? You can now drag and drop questions and pages, and add items directly into any part of a survey page.
These new survey builder improvements make it easier to structure your survey as you go. Move questions into the right order, insert new content exactly where you need it, and spend less time using move controls or adding items at the bottom of a page before repositioning them.
Our new tools:
Move questions or notes to any part of the page by using the drag handle.
Reorder pages by dragging the page tabs left or right.
Add a question or note anywhere on a page by hovering over the question divider and clicking Add item.
A simpler, faster way to shape your survey pages — and available now in the survey builder.
Clearer question types: Single answer and Multi answer are now separate
- Enhancement
We’ve made a change to how Choice and Grid questions work in Online Surveys, to make survey building clearer — and to protect your data.
Previously, Choice and Grid questions were each a single question type, with a toggle in the question editor to switch between single answer (radio) and multi answer (checkbox). That made it easy to miss what you were creating — and in some cases, changing this setting while a survey was open could lead to response data issues.
Now, we’ve split both Choice and Grid into two distinct question types:
Single answer (radio)
Multi answer (checkbox)
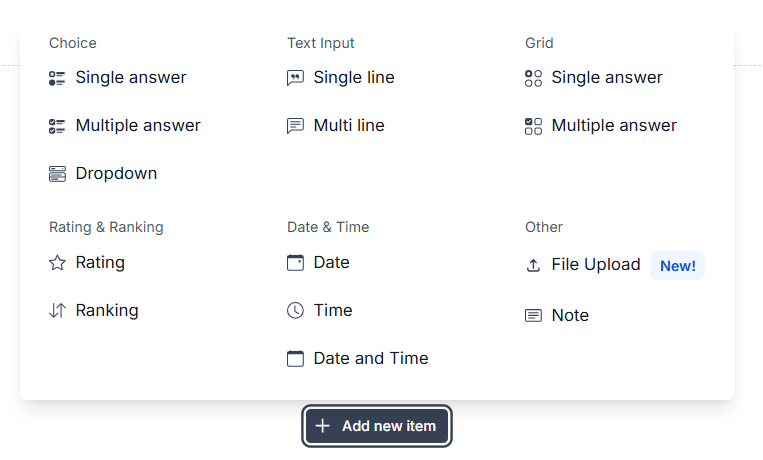
You’ll see these options upfront in a redesigned Add item menu, so it’s simpler to pick the right question from the start.
Why it helps:
Clearer question types up front make it obvious whether respondents can choose one answer or multiple.
Reduces accidental switching between single and multi answer, and prevents changes that could corrupt response data while a survey is collecting responses.
The redesigned menu creates space for more new question types and options as we expand the builder.
A small change that makes survey setup safer and easier — and available now in all surveys.
File upload is here – collect PDFs and images with your survey responses
- New feature
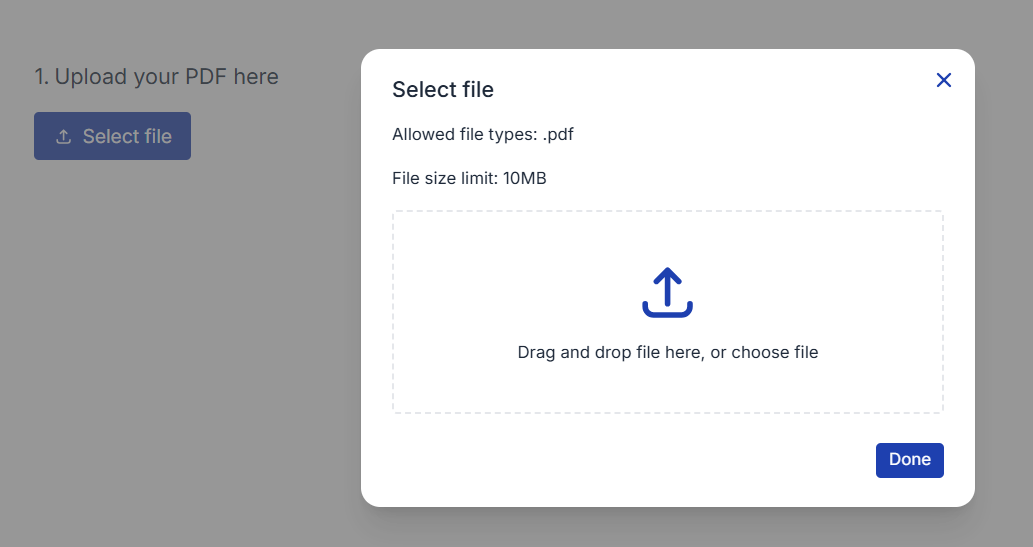
Need respondents to share supporting documents, screenshots, or photos? You can now add a File upload question to your survey.
With this new question type, respondents can attach a PDF or an image directly as part of their response — making it easier to gather evidence, examples, and real-world context alongside your standard survey answers.
What it means for you:
Gather richer evidence.
Reduce follow-up emails by getting everything you need at the point of response.
Support more use cases such as application-style surveys and research submissions.
A simple way to collect more than words — and available now in all surveys.