In this article
Insights
The Insights page helps you quickly understand how your survey is performing and how people are interacting with it. Whether you’re monitoring progress in real time or reviewing after it closes, Insights gives you a clear, visual summary of key trends and behaviours.
You can use this data to help you make better decisions about your survey design, timing, and distribution.
Finding your survey's Insights page
To view your Insights page:
- Find your survey on the Dashboard
- Go to the Analyse area.
- Click the Insights tab.
What does my Insights page tell me?
Survey progress
Responses: The total number of completed survey responses.
Response rate: A percentage that shows how many people completed the survey compared to how many you expected.
Running days: How long your survey has been open – from the day it was opened until today.
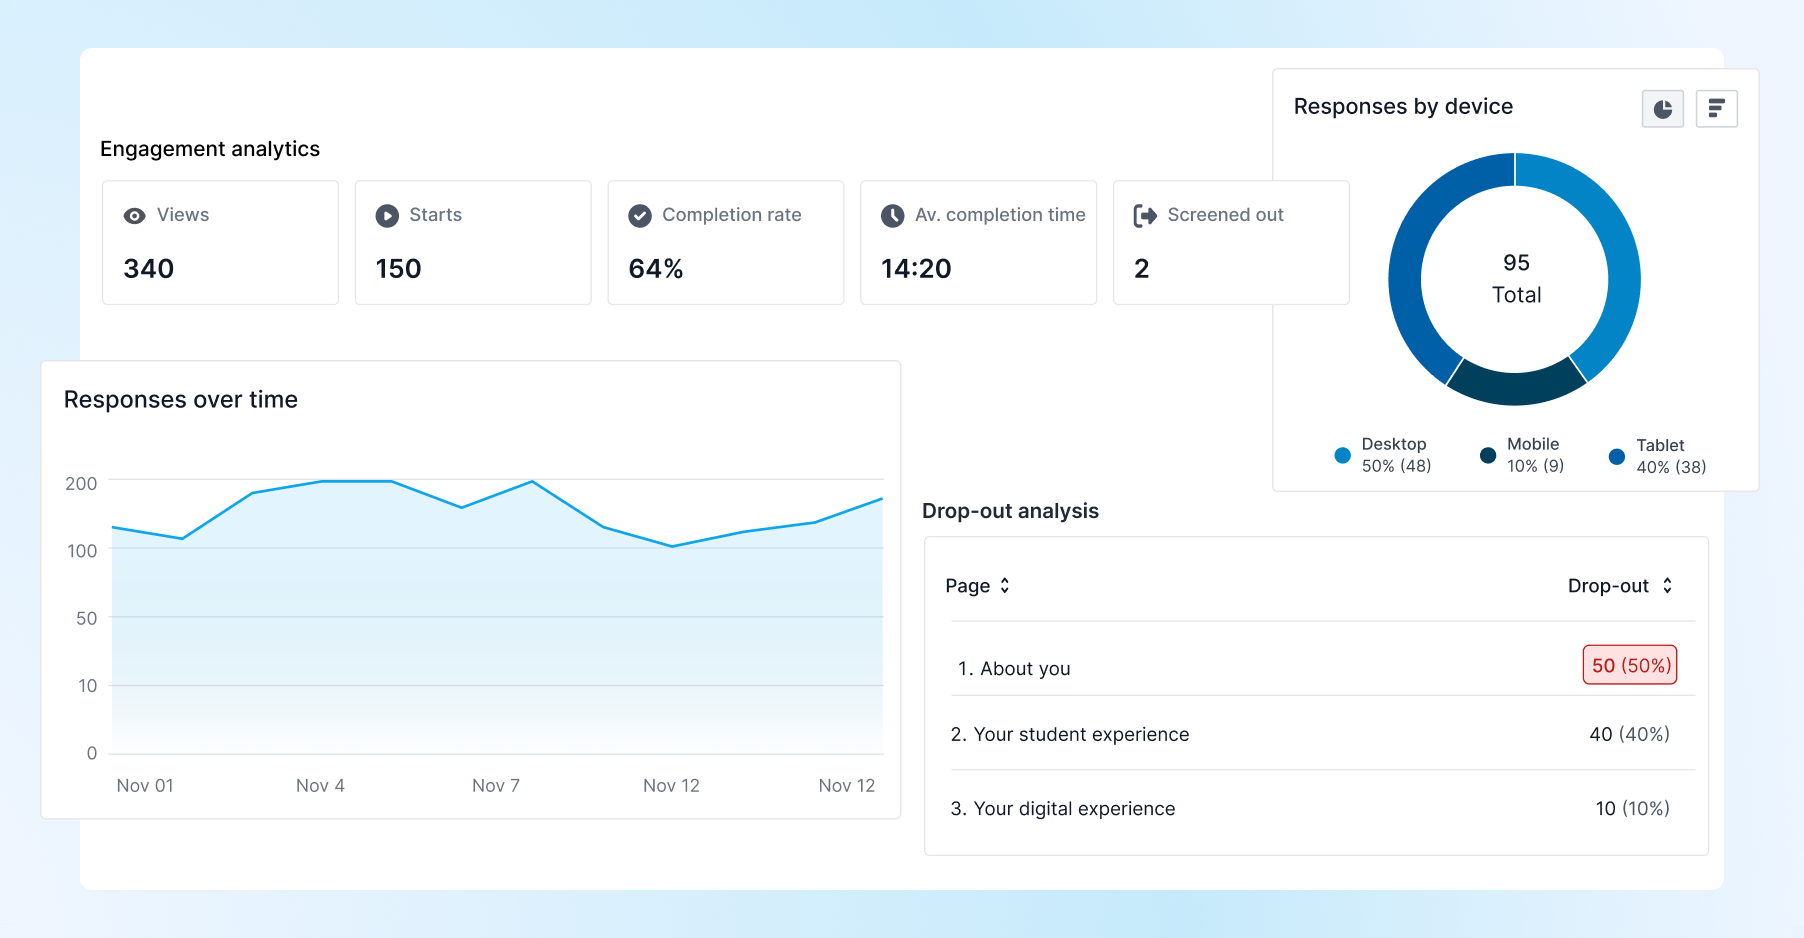
Engagement analytics
Views: The number of times your survey was opened in a browser – even if someone didn’t start answering.
Starts: The number of people who actually began the survey (i.e., answered at least one question).
Completion rate: Of the people who started the survey, this shows how many made it all the way to the end.
Average completion time: How long, on average, it takes people to finish your survey.
Screened out: If your survey uses screening logic, this shows how many respondents were screened out and didn’t continue.
Responses over time
This chart shows how many responses your survey received each day while it’s been open. It helps you visualise trends in participation over time.
Understanding when responses peak or dip can help you:
Identify the impact of specific outreach efforts (e.g. reminder emails, social posts)
See if interest drops off quickly after launch
Spot engagement patterns
Responses by Device
This chart shows which types of devices your respondents used to complete the survey — desktop, tablet, or mobile.
Knowing which devices your respondents are using can help:
Inform future survey design
Test assumptions about your respondents’ behaviour
Drop-out analysis
Drop-out analysis shows you from which pages respondents are leaving your survey – helping you understand which pages may be causing confusion, frustration, or disengagement.
High drop-out rates can indicate:
Questions that are too long or complex
Topics that make respondents uncomfortable
Poor survey flow or structure
Filtering your Insights data
You can filter your Insights data by:
- Default or custom date ranges
- Device used