
Online Surveys > Blog > Survey Summer School, week five: from responses to decisions

Survey Summer School, week five: from responses to decisions

The last in a five-week series to help you get the most out of your Online Surveys free trial or subscription.

Your survey is live and we’ve learned how to get responses coming in. This week, we’ll look at two things: how to use the analysis tools, and how to make sure the results actually have an impact.

You don’t have to wait until the survey closes. As soon as it’s launched you can start analysing responses.

Analyse overview

Open your survey from the dashboard and choose Analyse in the sidebar. You’ll land on the Analyse Overview page. You’ll see a chart or visual for every question, plus the tools for filtering and exporting.

For choice, dropdown and grid questions you get four ways of looking at the same data:

  • Horizontal bar is the default and is easy to read at a glance
  • Vertical bar is available for the same question types. It works well for anything with a natural order like age bands, rating scales and time periods since the left-to-right progression matches how people read a sequence
  • Pie charts are available for questions with five options or fewer. Pie charts stop being readable at around five slices
  • Tables give you the answer options in survey order with a count and a percentage for each. These might be less visually appealing but they are often the thing you actually want, particularly for a written report, where a reader needs the actual numbers rather than an impression of them.

For multi-answer questions, note how the percentages work: each is calculated as the proportion of respondents who chose that option. They may add up to more than 100%.
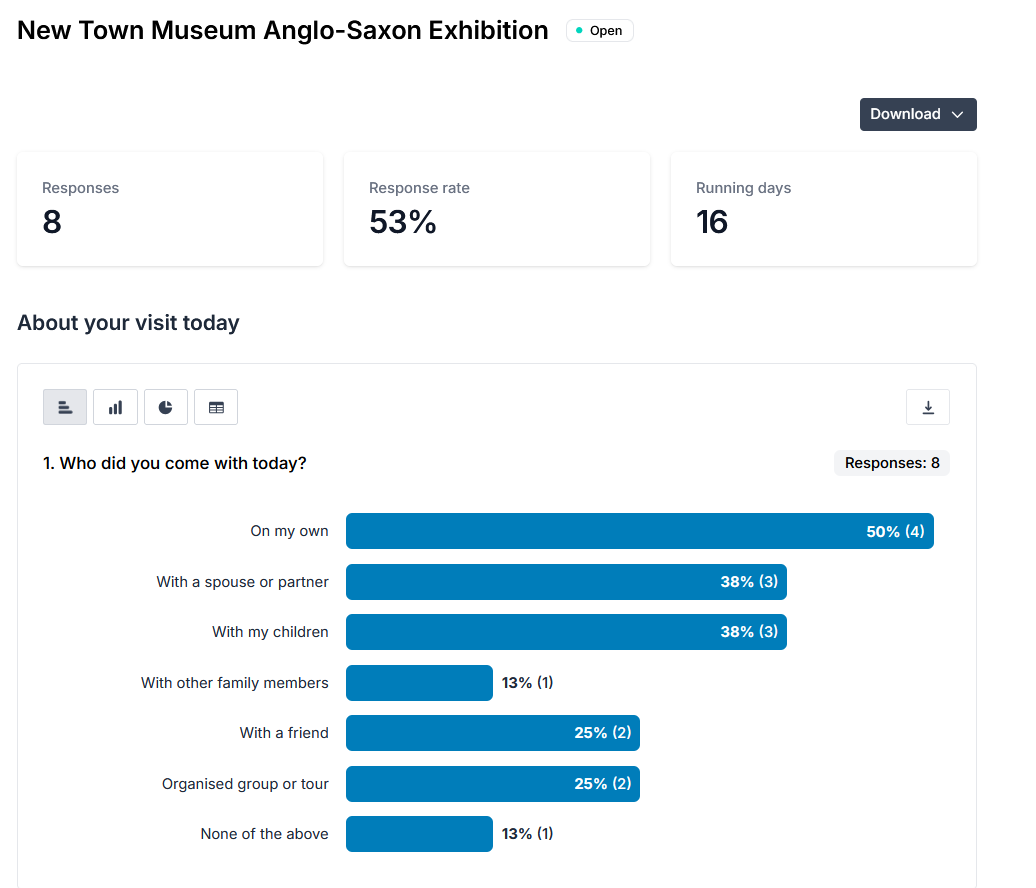
Analyse overview page showing data in a chart
Analyse overview page

Free text

Answers to your single-line and multi-line questions appear in their own scrollable display. Each free-text answer links through to that individual’s full response. Click it and you can see everything that person said.

This can transform qualitative analysis. A comment like “The timing of the class didn’t work for me” is not helpful in isolation. Click through and you find that this respondent is a part-time student who works weekdays, attended two sessions out of six, and rated the course content highly. With that context, you know more about what they meant and what you could do about it.

This is also how you could find quotes to use in reports. Before you put a comment in a report, click through and read the rest of that person’s responses, so you’re not quoting someone approvingly on one page whose overall verdict was actually more mixed or negative.
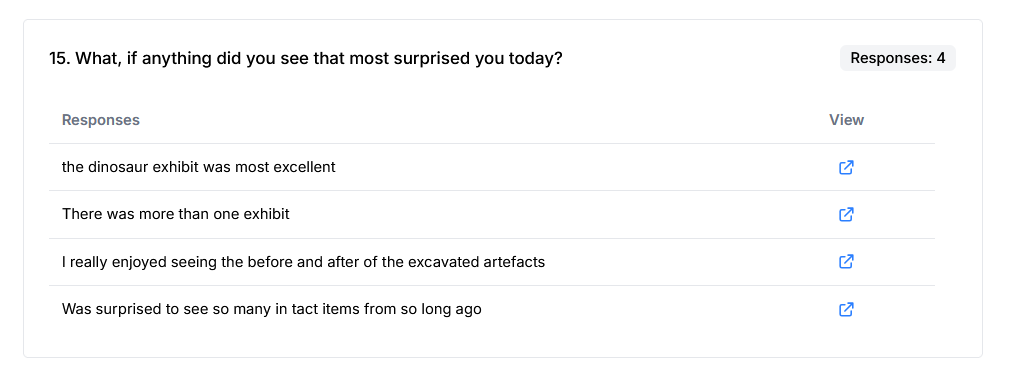
Free text display on the Analyse Overview page

Filters

The Analyse Overview shows you how everyone responded. You can also look at where groups differed, which can be even more interesting.

Expand the Filters tray on the right-hand side and you can filter by:

  • response date
  • question number

On the Filters tab you can set up custom filters so the filters tray will also include:

  • answers given by respondents

Filtering by answer is how you can undertake more detailed analysis. Filter to just the volunteers, and read the same charts again. Filter to people who rated the experience poorly, and read their free text. Filter to first-time visitors, and compare them with returning ones.

Filters apply to your charts and your exports. If you set a filter and export your data, you will get the filtered data. Just remember to toggle the filters off if you want to export your data in full.
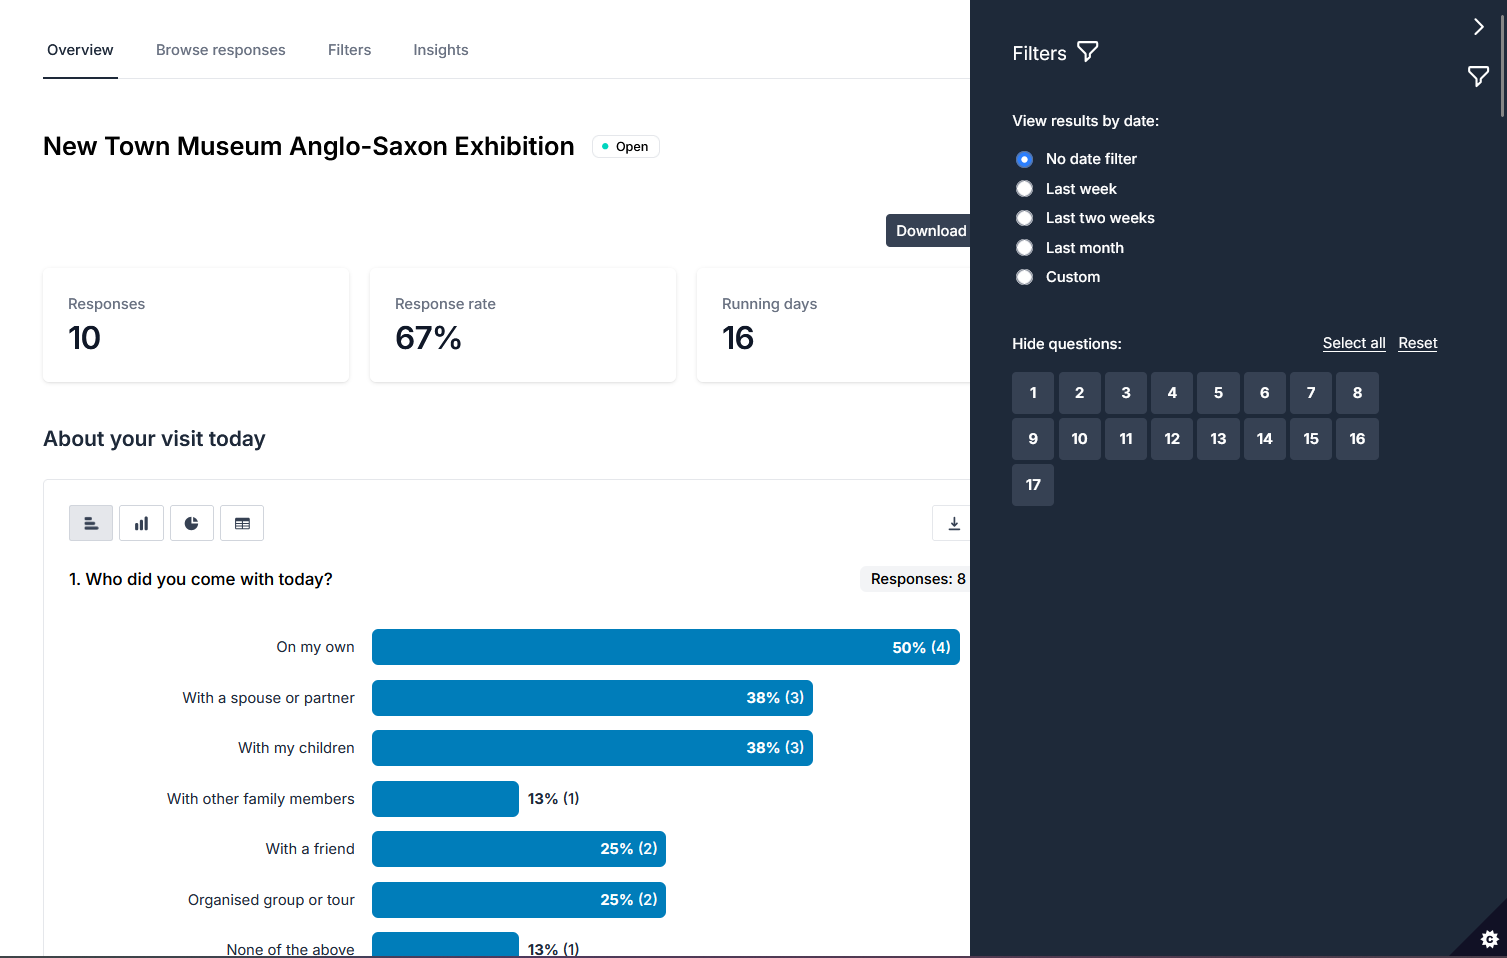
Filter toggles on the analyse overview page
Filter toggles on the Analyse Overview page

Statistics and response rate

For quantitative questions the platform will give you basic statistics: the means, medians and distributions you’d otherwise be calculating in a spreadsheet.

You’ll also find your response rate on the Analysis Overview page. This is calculated from the expected responses figure you set last week. If you skipped that, you can add it retrospectively.

Insights: learn how you might get a better response rate next time

Under the Insights tab you’ll find an analysis of how people interacted with the survey rather than what they said:

  • respondent dropout: where people abandoned the survey
  • responses over time
  • responses by device
  • average completion time
  • views, starts and completions

Every one of these is useful, but dropout is the one to look at first because it can tell you which questions may have lost your respondents.

If 40% of the people who started your survey left on page 3, page 3 might have a problem. Maybe it’s a ten-row grid. Maybe it’s a required question people don’t want to answer. Maybe it’s the point at which someone realised how long this the survey was going to take and they decided they’d rather not. You can use this information to improve the next iteration of the survey.

Responses over time shows you the shape of your response curve, including exactly what your reminder did.

Responses by device stats might impact how you build your next survey. If most of your responses came from phones (and for student, visitor and public audiences they usually do) that’s an argument against wide grids and long option lists.
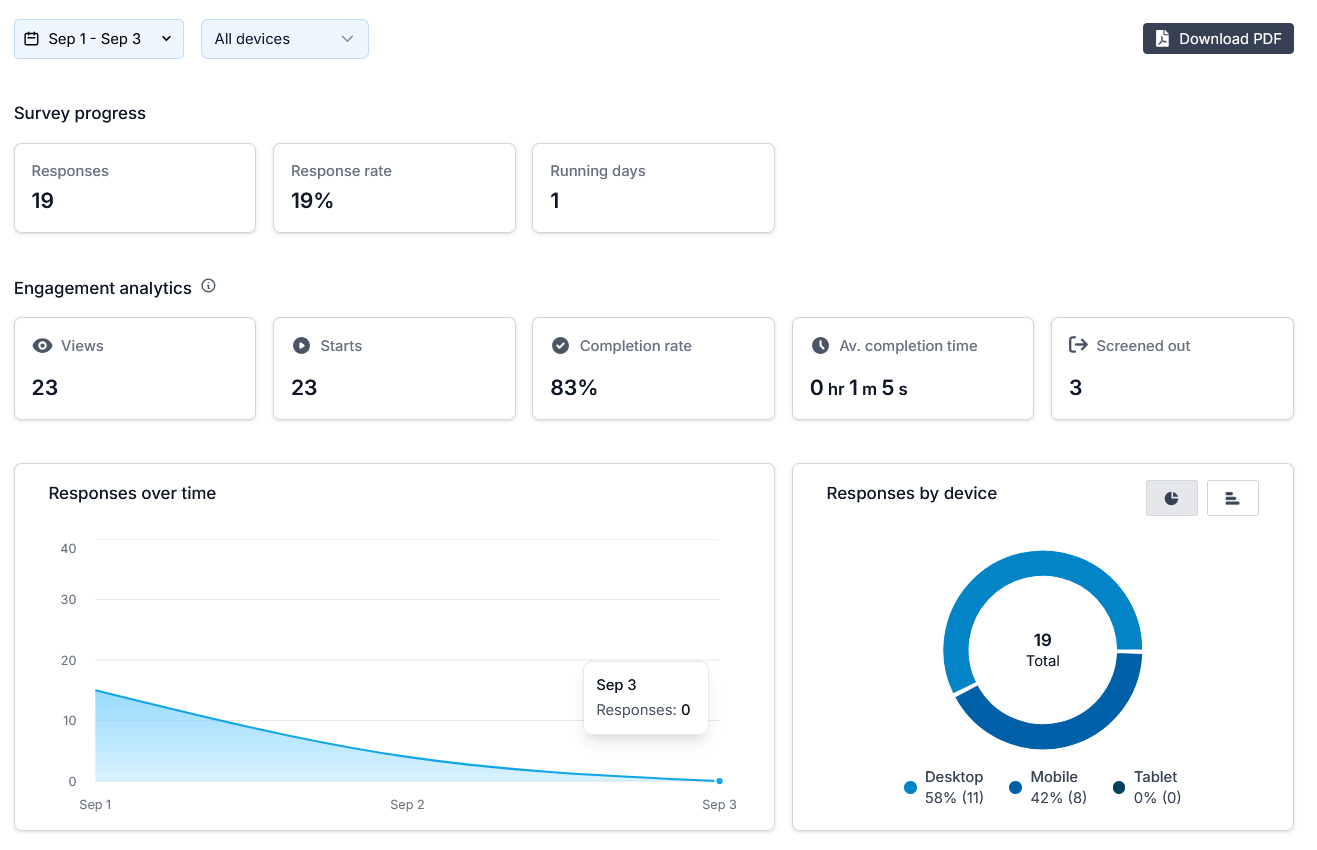
Insights page
Insights page

Getting your data out

You can download responses from the Analyse Overview page in several formats, and which you want depends on what you are going to do with the data:

PDF summary: a rendering of your Overview for offline reference. Good for circulating or filing, but not something you can easily do further work on.

XLSX and CSV: for spreadsheet analysis, importing into Power BI or AI platforms, or for combining survey data with anything else you hold. Note that CSV comes in coded and uncoded versions: uncoded gives you participant answers as text, which is what you want if a human is going to read the file, but coded gives you the underlying values, which is what statistical software wants.

SPSS: for those doing statistical work.

Individual responses, and the data protection bit

You can also browse individual responses, download any of them as a PDF, and delete individual responses. Go to the Analyse area and click onto the Browse Responses tab.

If a respondent exercises their right to have their data erased, you need to be able to find and remove their response. Being able to do that cleanly, in a European hosted, ISO27001-certified platform, is a large part of why organisations handling sensitive feedback use Online Surveys rather than whatever’s bundled with their office software.

The last step, and the most important bit

You now have findings, and you can turn them into actions.

Report the uncomfortable parts. The critical ratings and free text is where you can find improvements to make.

Turn findings into named actions.Satisfaction with session timing was low” is a finding. However, “We’re moving our Monday evening sessions to Tuesday evenings from October” is an action. The latter changes things for the better for your respondents.

Close the loop, publicly. Tell your respondents what you did. “You said, we did” really works. It’s also one of the best things you can do for your next survey’s response rate, because it converts responding from a favour into something with a visible return.

Run the survey again. The same survey next year is worth far more than a new survey next year, because you’ll have comparison data. This means you’ll start seeing movement, or a direction, and not just a moment in time.

Beyond the trial

You’ve built and piloted a real survey. A subscription gives you unlimited surveys and the powerful distribution tools from last week, which together turn a one-off exercise into something you can repeat year on year.

Your 15-minute task

  • Browse through your free text responses
  • Apply one filter that splits your respondents into two groups, and compare them
  • Look at your dropout analysis on the Insights tab and find the page that cost you the most people
  • Export a PDF summary and an CSV file
  • Write down three actions you can take away from your data

That’s all for now!

Over five weeks you’ve built a survey with a decision behind it, routed it with logic, personalised it with piping, distributed it, and analysed it.

If you’ve been building and piloting alongside us, you should have something you could refine and launch this autumn!

Full guidance on analysis, filtering, insights and exports is in the Online Surveys help pages

Survey Summer School: Week 1

Survey Summer School: Week 2

Survey Summer School: Week 3

Survey Summer School: Week 4

Survey Summer School: Week 5